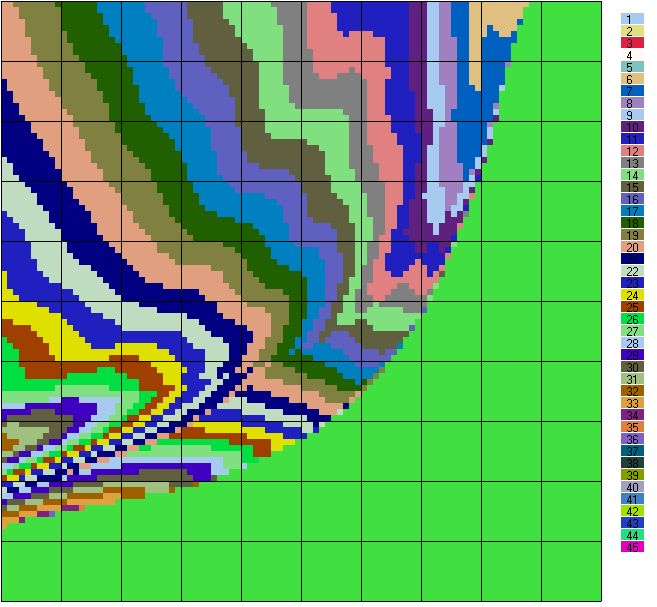
Visualization of the Skunk Strategy

This is a visualization of the Skunk strategy. It is not quite the entire thing because it omits those funny areas where the strategy is not a single stopping number but has a gap that can be jumped. These areas necessarily land right on the boundaries of the folds. i.e. if you just take the first stop number from the chart and graph it you get this picture.
The big matrix is the 100x100 picture with each different stop number in a different color. The M score (My score, the guy with the dice) is displayed in the horizontal direction increasing to the right and the Y score is displayed increasing as it goes down. The legend on the left shows the stop scores.
The big solid patch of color that is in the lower right corner of the matrix is not in the legend and does not represent a stop number. Instead, it represents the strategy of GO FOR IT, meaning roll whatever you need to win.
From the picture you can see the neat folds in the solution manifold including the retrograde motion area.
If you look at this and think for a moment about what a fuzzy expert system that played the game would do, you would have expert rules like "If you are way ahead of your opponent don't try to roll such big numbers". A rule like this once you assign numerical thresholds to the "way ahead", "slightly ahead", "almost tied", "slightly behind" ... is carving up the space into bands that run at 45 degrees down and to the left, roughly matching the basic shape of the color bands. Then you would have rules like "However if you are close to winning, or if your opponent is very close to winning then you better go for it." A rule like this captures most of the bottom edge and the right edge that is the rough shape of the GO FOR IT zone. Other rules would presumably need to be designed that would capture some of the folding that goes on over on the left hand side when you have gone bust (got near 0 points) and your opponent is pretty far along.
I think I have just about exhausted what I can do for Skunk. The only other thing I have thought about is that I could generate a second 100 by 100 by 100 matrix that would accompany the strategy matrix that instead of giving the probability that you will win from that state, gives the probability that you will achieve that particular state. A matrix like that can be thought of as a distortion field for the strategy map that indicates what parts of the strategy are more often called into play. This would allow you, if you were building an expert system to play the game, to generate maximum coverage of states that you are likely to reach with the minimum of rules.
Back to the Strategy text. To the Skunk Chart